🧮 Model maps
Every model, every product — MetPy × Cartopy renders from NOAA/ECMWF GRIB2 · East Tennessee + US · updated 2026-10-02 6:24 PM ET
Sponsored
⭐ TNWN Premium - advanced AI model maps, long-range library, ad-free. $4.99/mo · cancel anytime
⭐ TNWN Premium - advanced AI model maps, long-range library, ad-free. $4.99/mo · cancel anytime
📊 Render progress
Counting rendered maps…
checking NOAA upstream feeds…
checking upstream latency…
Per-model completeness + freshness - worst first, so a stalled NOAA feed or a starving model shows at the top. ● current · ● catching up (NOAA published a newer cycle) / renders pending · ● waiting on NOAA. Refills every 5 minutes.
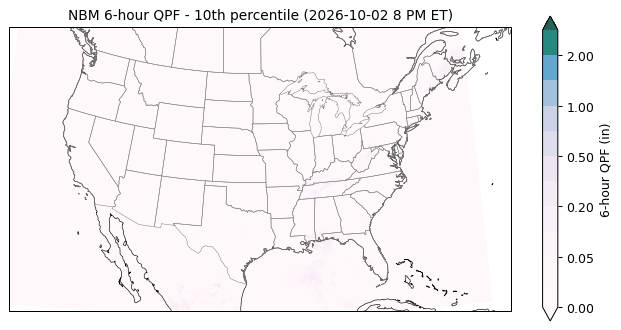
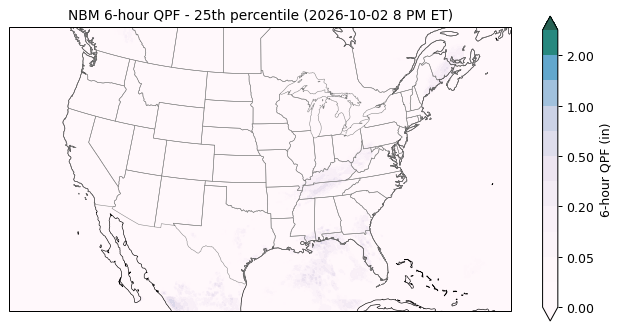
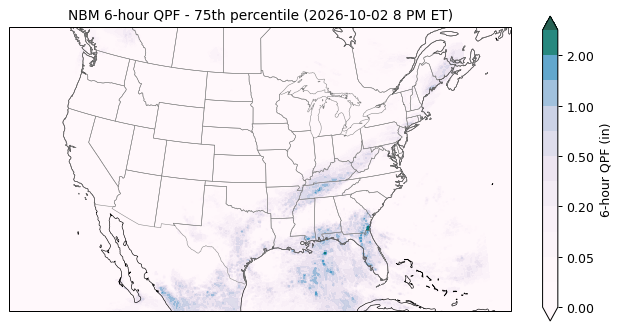
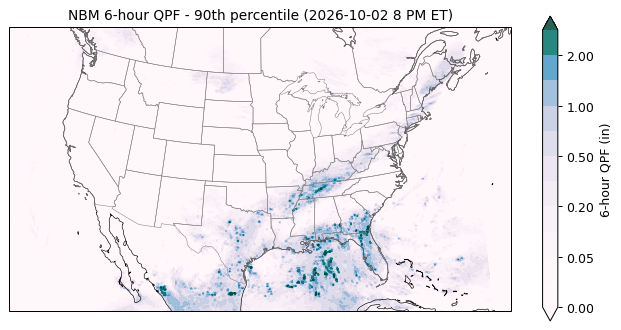
🎯 NBM uncertainty - percentile spread (QMD)
The regular NBM walls show the pre-blended median. These maps slice the NBM's full forecast distribution: the 10th percentile is the floor almost nothing gets colder/lighter than, the 90th the ceiling, and the Spread panel (90th-10th) shows where guidance itself is least certain. 2 m temperature, 10 m wind and 6-h QPF · valid 2026-10-02 8 PM ET (init 2026-10-02 8 AM ET, f012) · decoded from NOAA's open-data QMD files.
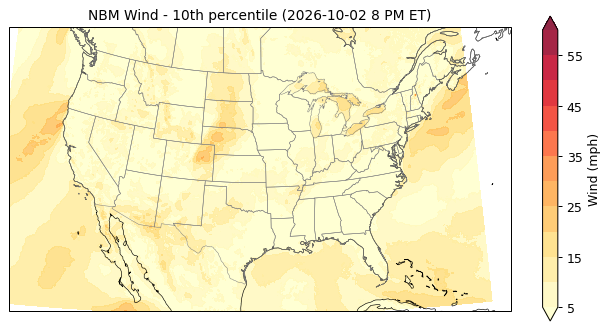
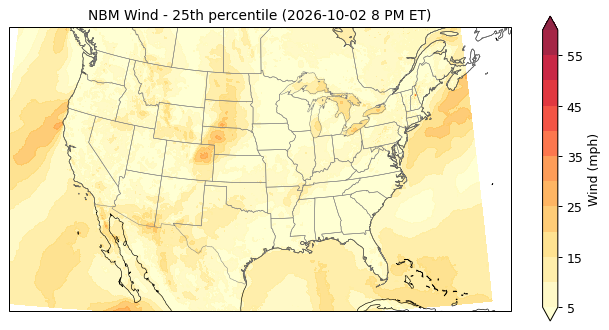
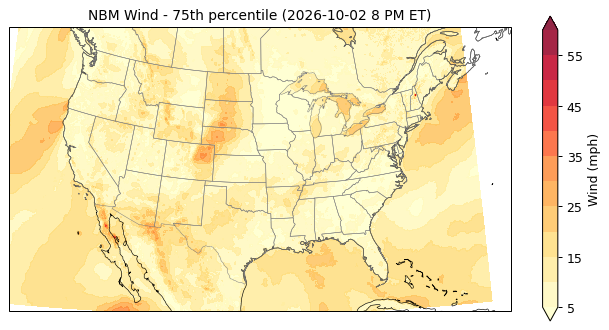
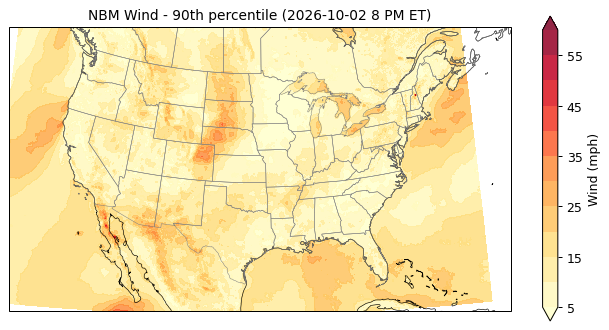
🌐 GEFS North America 31-member ensemble mean | spread · init Fri 8 AM ET · 8 days at 0.5° · our MetPy render from NOAA's AWS open data
--
NOAA's Global Ensemble Forecast System runs 4× daily (00/06/12/18 UTC). Most frames are two panels: the 31-member ensemble mean - the smoothed “big picture” - and the ensemble spread (std dev), showing where the members disagree. The Day high / low product pairs each day's TMAX and TMIN means with a town-by-town East TN table; Winter precip type shades the probability a member produced snow (blue), ice (purple) or freezing rain (orange). Out to 192 h (8 days): MSLP + 500 mb heights, temperature, wind, QPF, daily highs/lows, CAPE, PWAT moisture, the 250-mb jet, and winter precip type.
🔍 Render any model product
Pick a model + product and hit Render - the map renders server-side (GRIB decode, ~10-60 s first time, then cached).
🗂️ 4-pane model comparison (all models · all levels · animated)
Product / level
Area/View
--
All 20 models (NWS global + CAM + AI + MPAS + FV3) × every product/level, animated side-by-side — each pane plays its own loop and the big clock advances every pane that has that hour. Missing hours snap to the nearest earlier frame; unrendered combos queue and fill in automatically — watch the 📊 render-progress bar at the top of this page.
🗺️ US forecast collage — every model, same hour, one wall
Wall
Product
Init
--
Area/View
Scroll to zoom · drag to pan · one camera for the whole wall — zoom to Tennessee and every model snaps to the same neighborhood. Switch the wall to East TN for the site's native sharp renders of our region. 🔗 Share copies a link that reopens this exact view.
One tile per model at the same valid time — spot model-to-model disagreement instantly, like the Pivot forecast wall. Click a tile to blow it up with the full animated loop; ▶ Wall animates the valid hour across every model at once. Tiles missing the exact hour snap to the nearest earlier frame and say so.
🎯 Severe composite threat — towns in parameter air
checking the latest HRRR run…
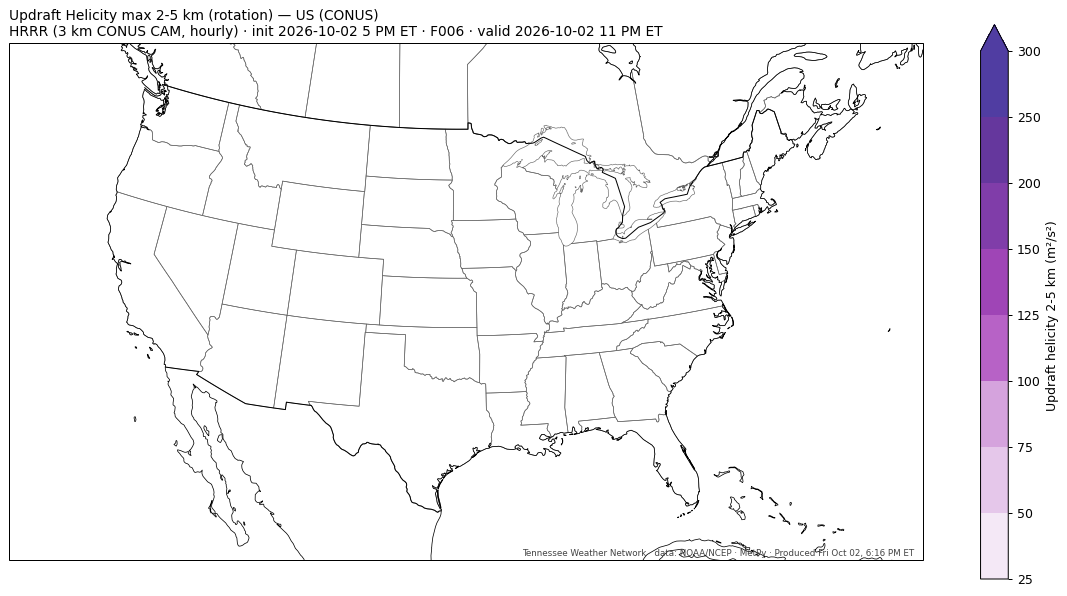
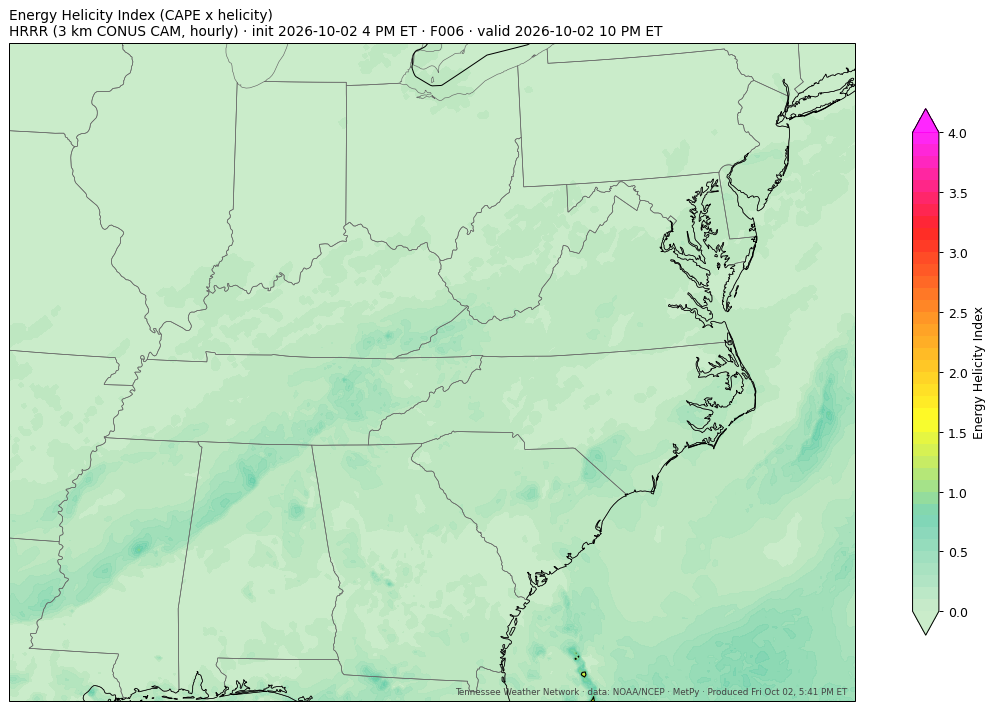
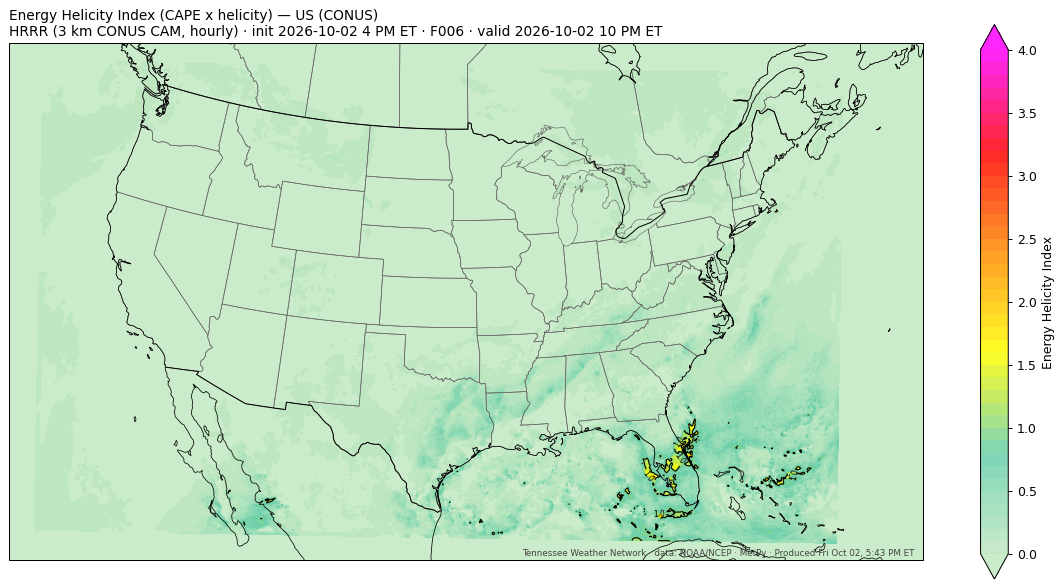
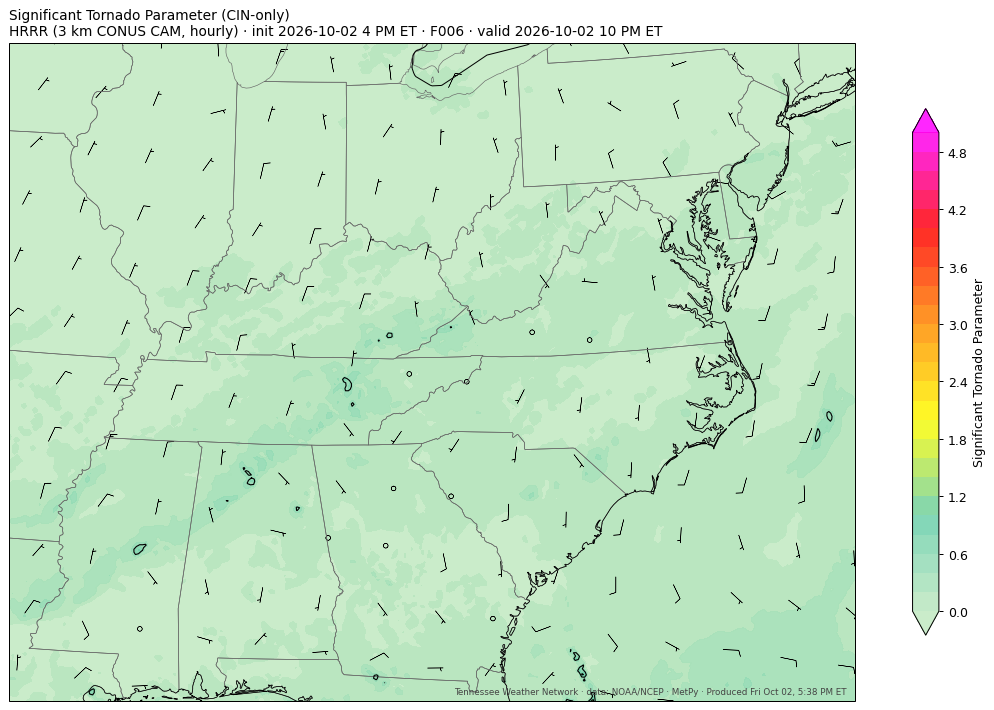
Every East TN town is sampled at its nearest HRRR gridpoint and evaluated with the exact SCP / STP / EHI formulas the severe walls above render — towns whose peak composite crosses the SPC threshold (≥ 1) rank highest over the next ~12 h. Badge colors follow the SPC palette.
🎞️ HRRR 15-minute future radar loop (PSU e-Wall · init 2026-10-02 4 PM ET)
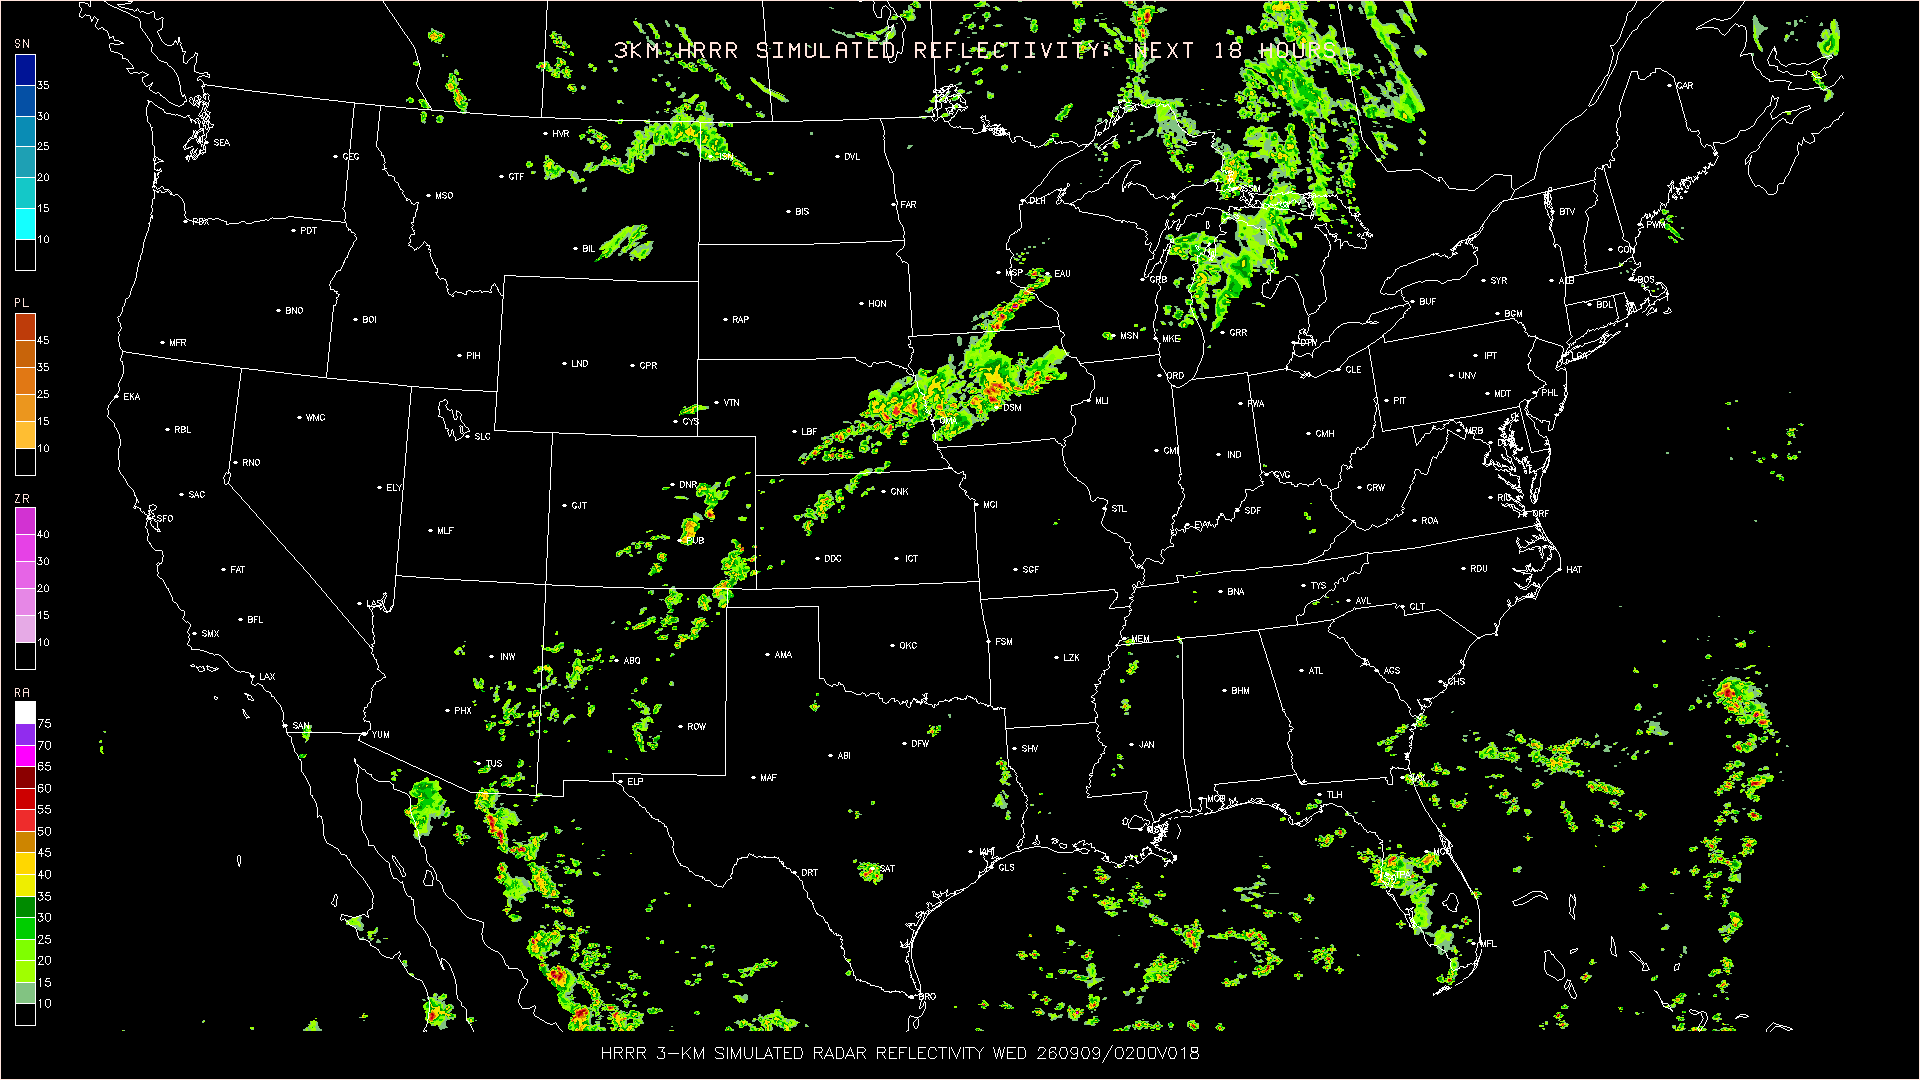
F18.0 · Sat 10 AM ET
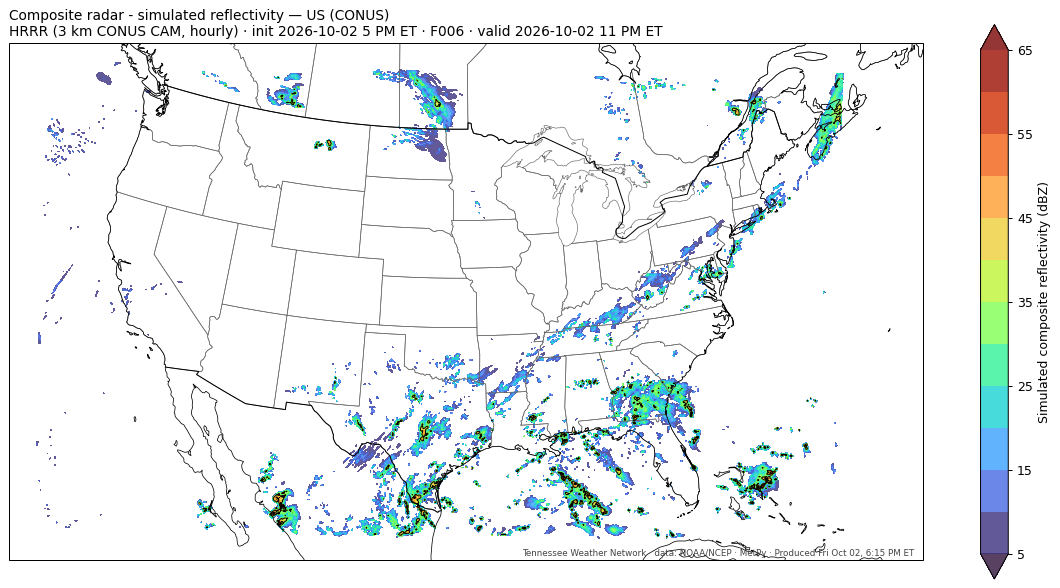
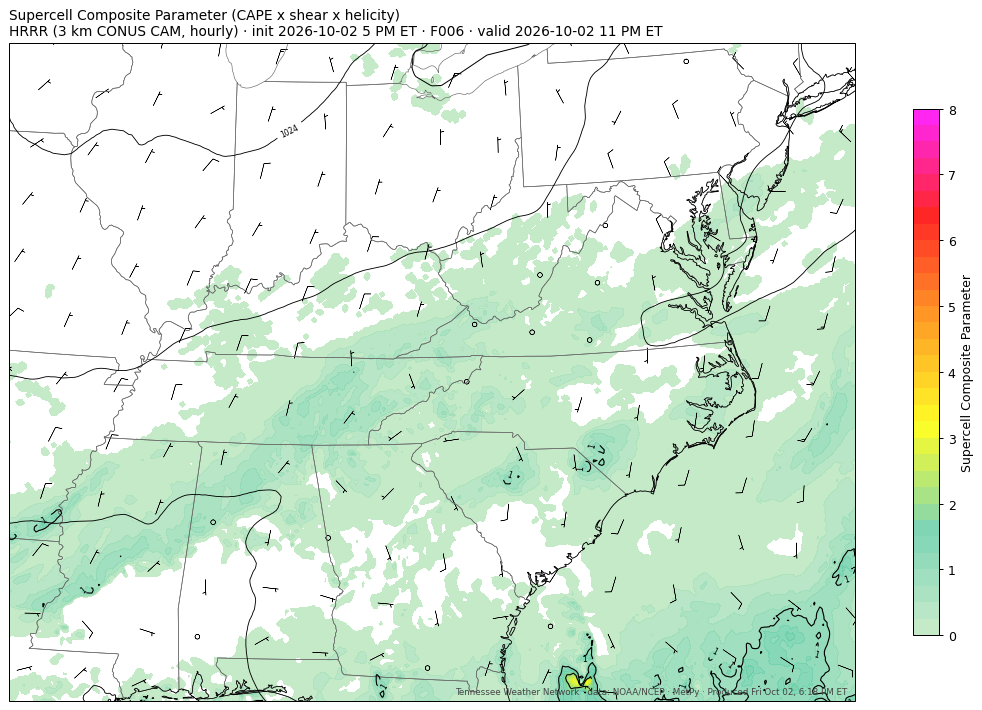
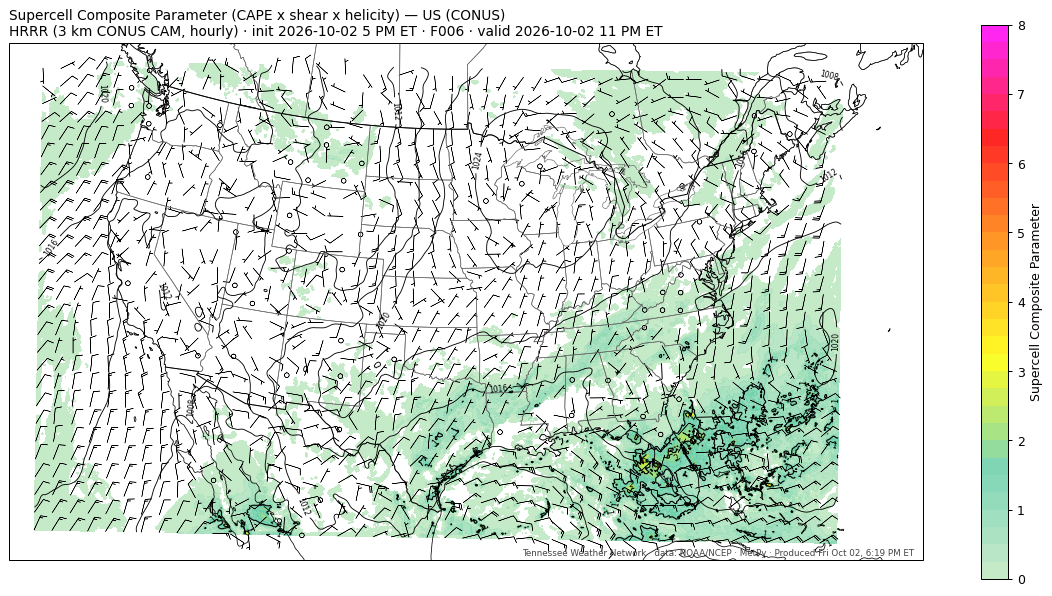
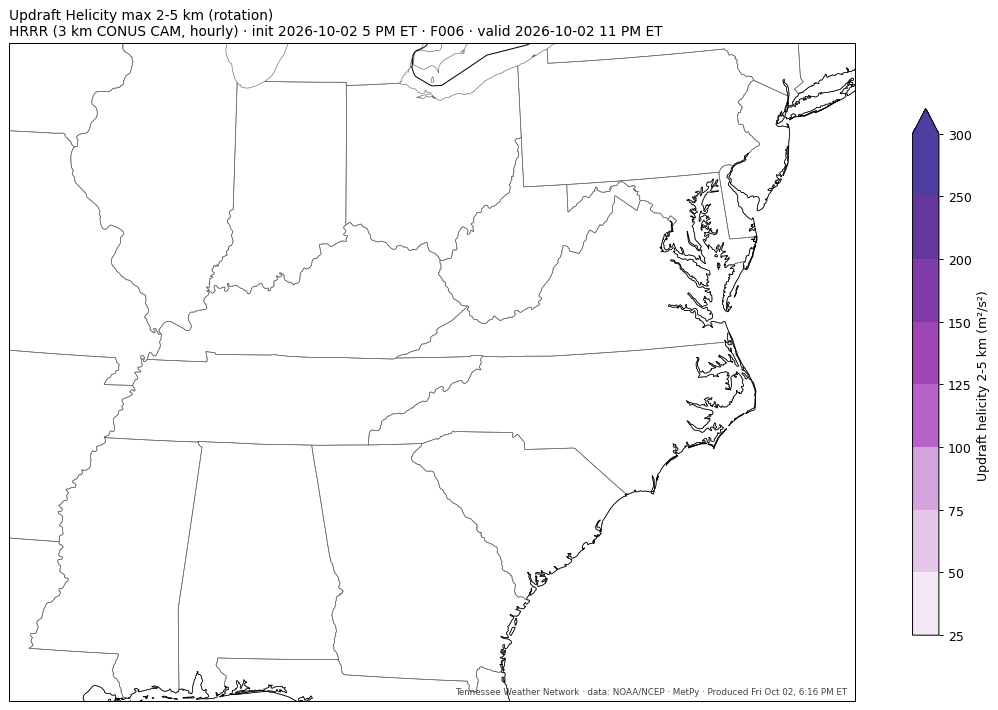
NBM · nbm_qpf (etn · init 1002Z 20Z)
Rendered locally with MetPy · full size
single frame - more hours render each update cycle
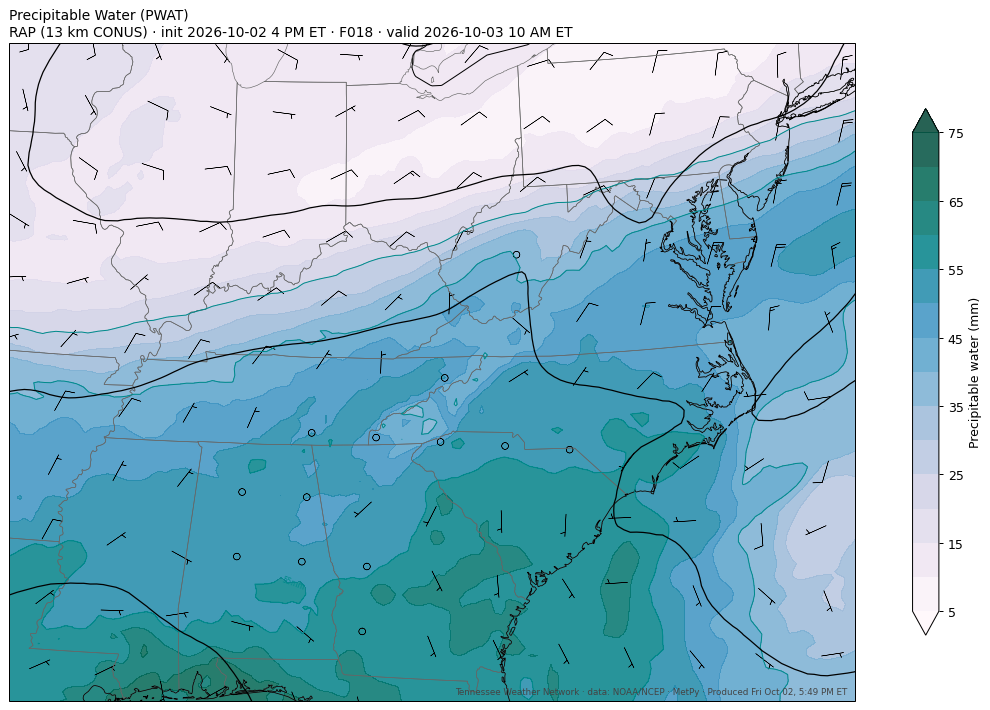
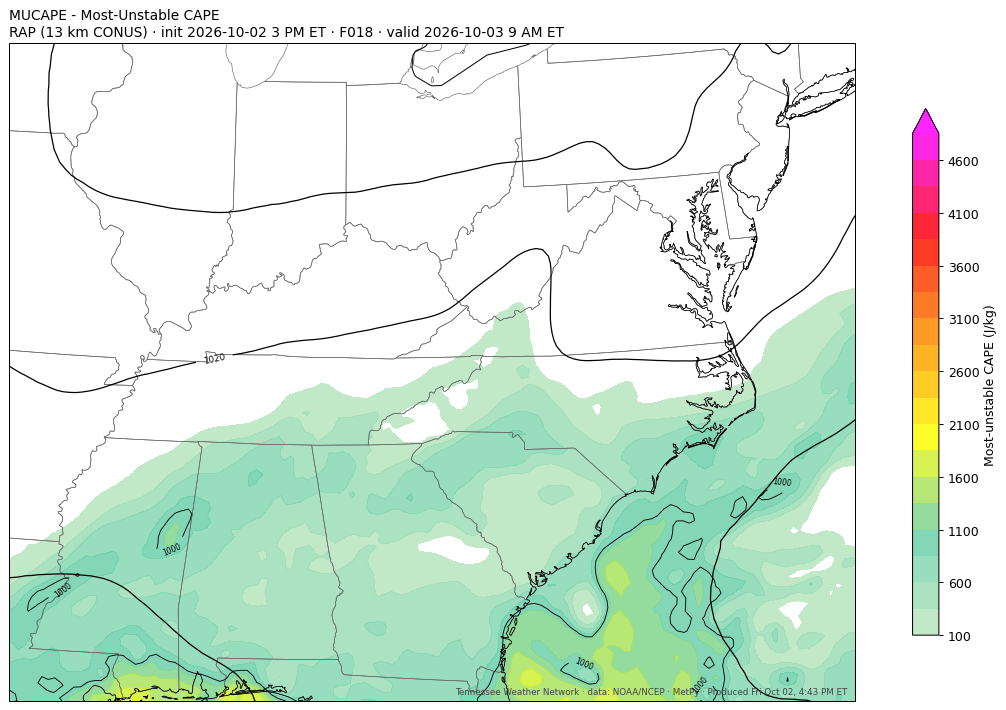
GEFS · cape_wind (us · init 1002Z 18Z)
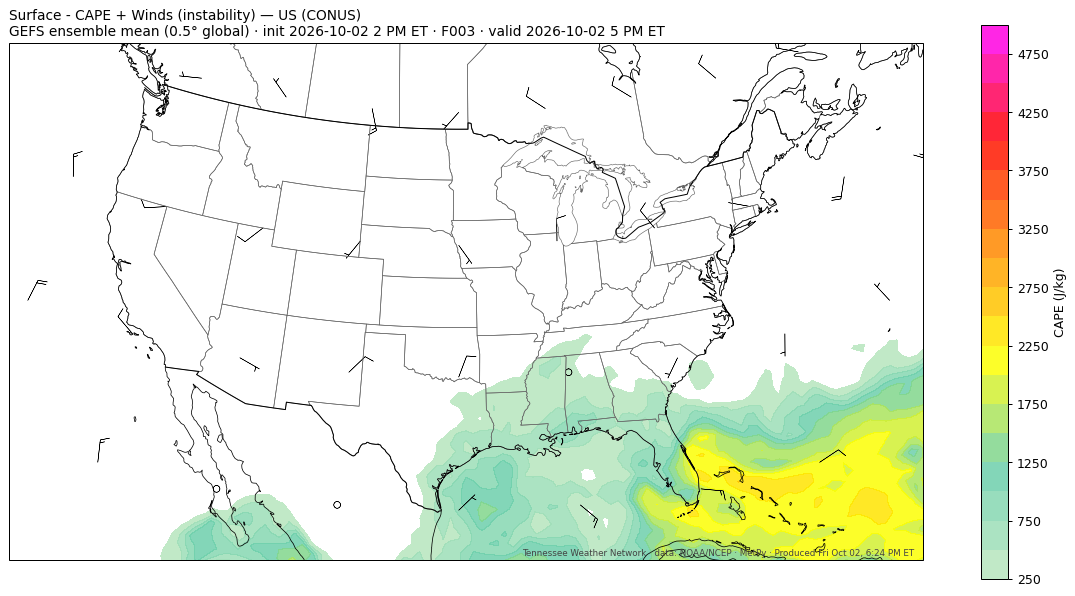
Rendered locally with MetPy · full size
single frame - more hours render each update cycle
GFS · 600_tmp (us · init 1002Z 18Z)
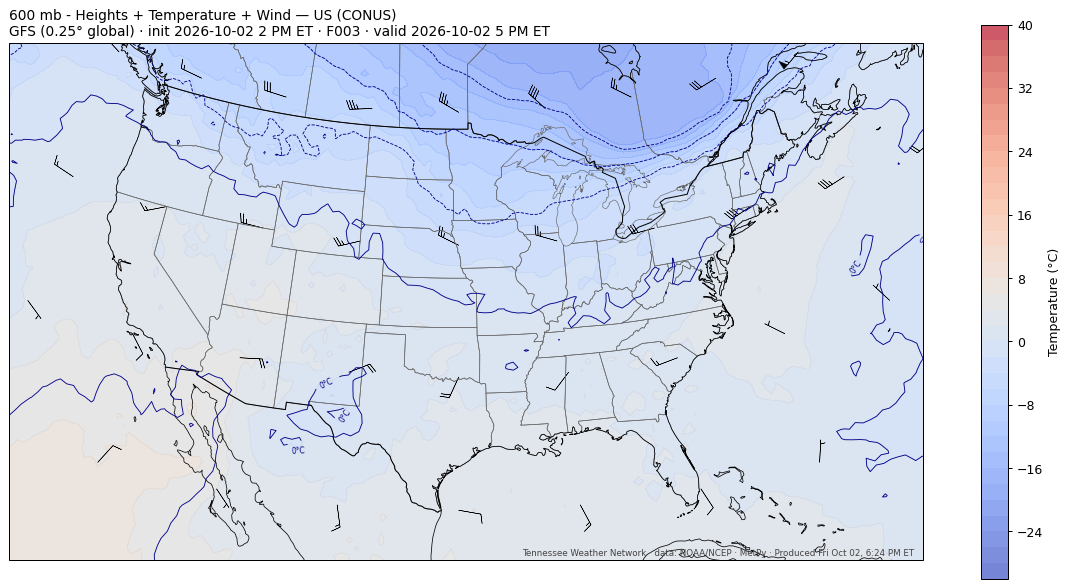
Rendered locally with MetPy · full size
single frame - more hours render each update cycle
NAM · 250_jet (us · init 1002Z 18Z)
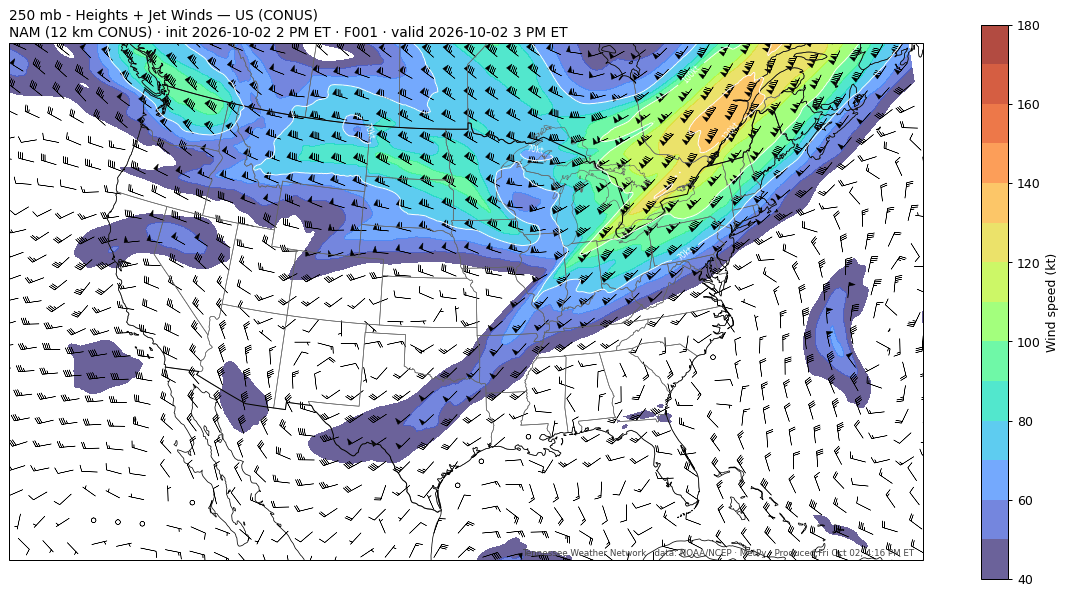
Rendered locally with MetPy · full size
single frame - more hours render each update cycle
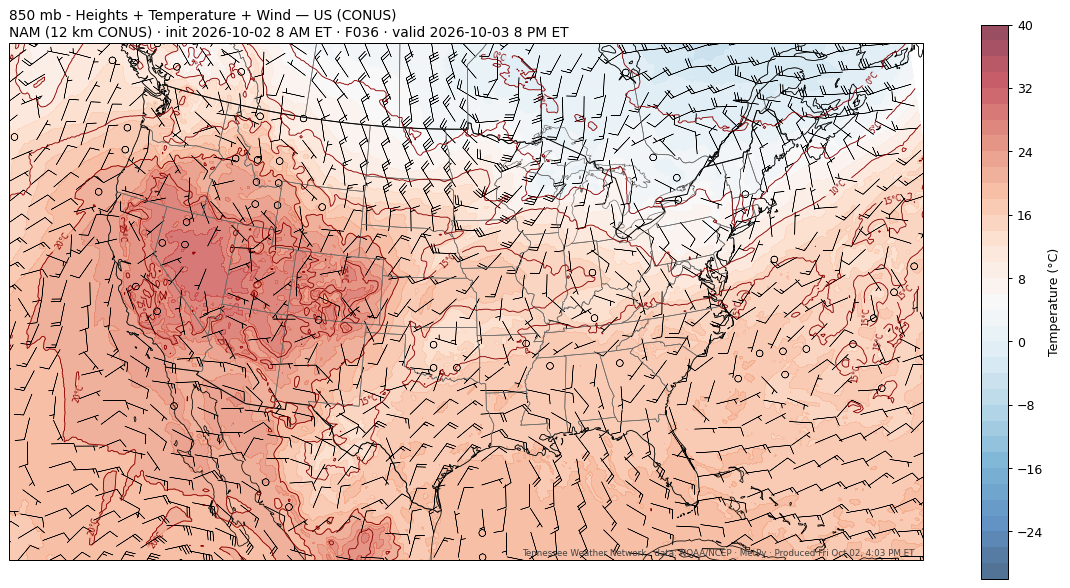
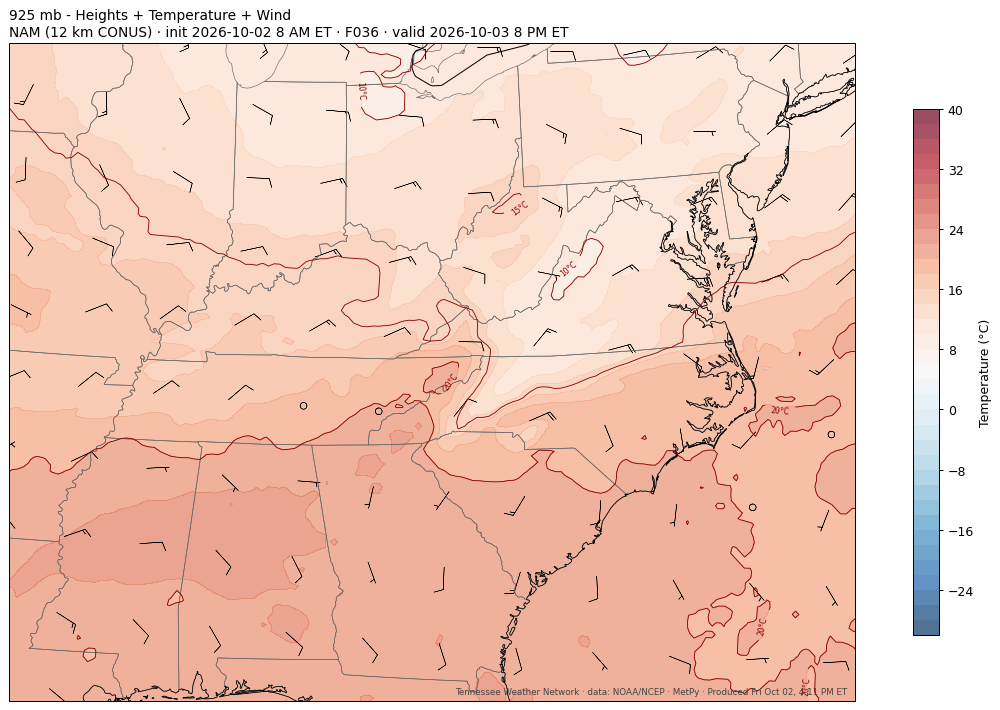
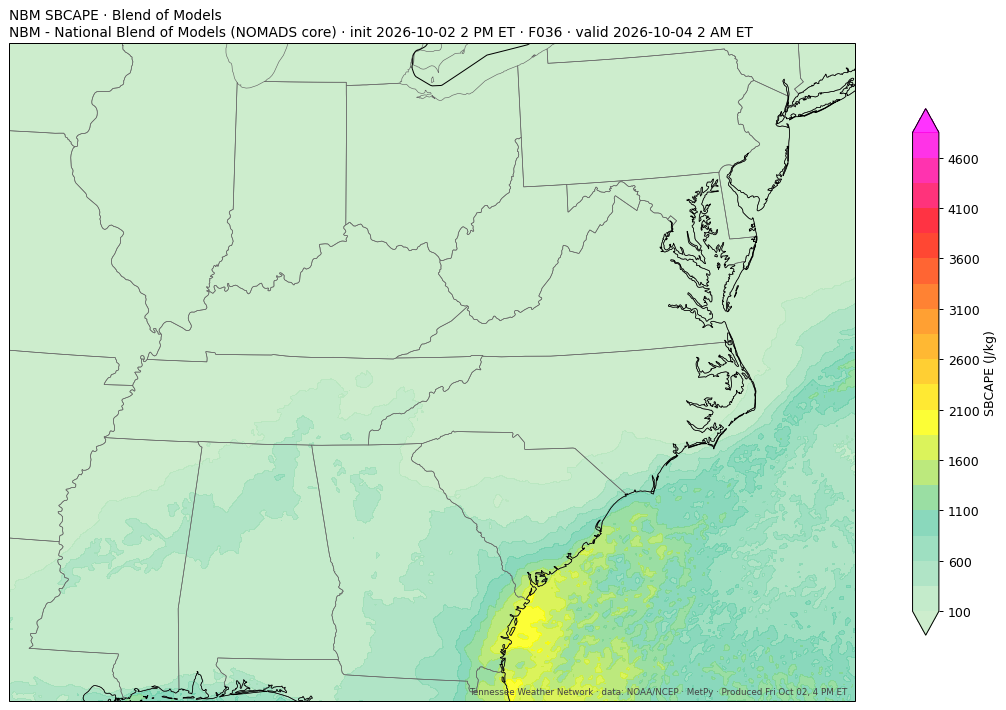
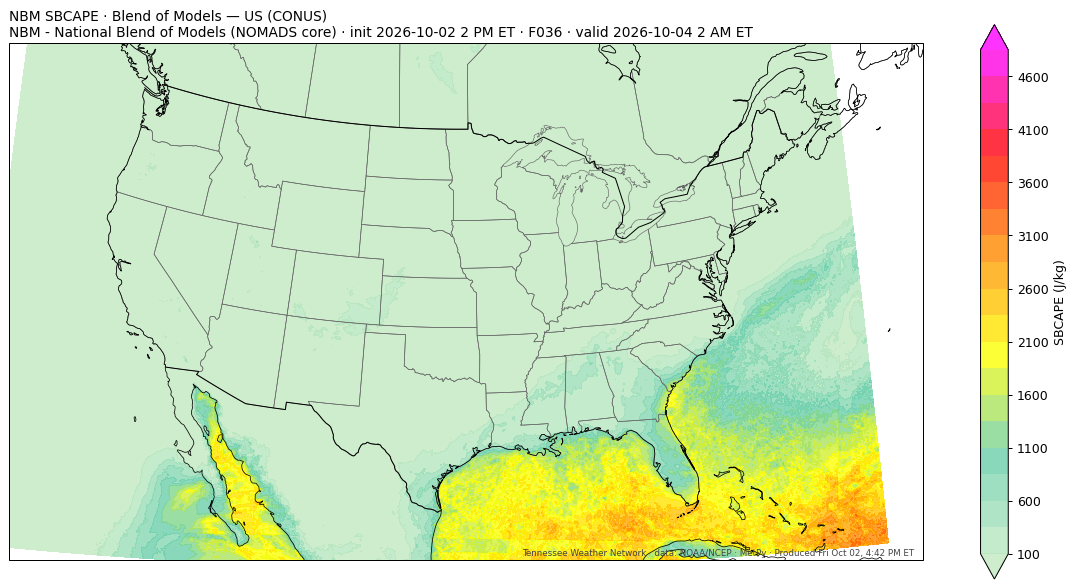
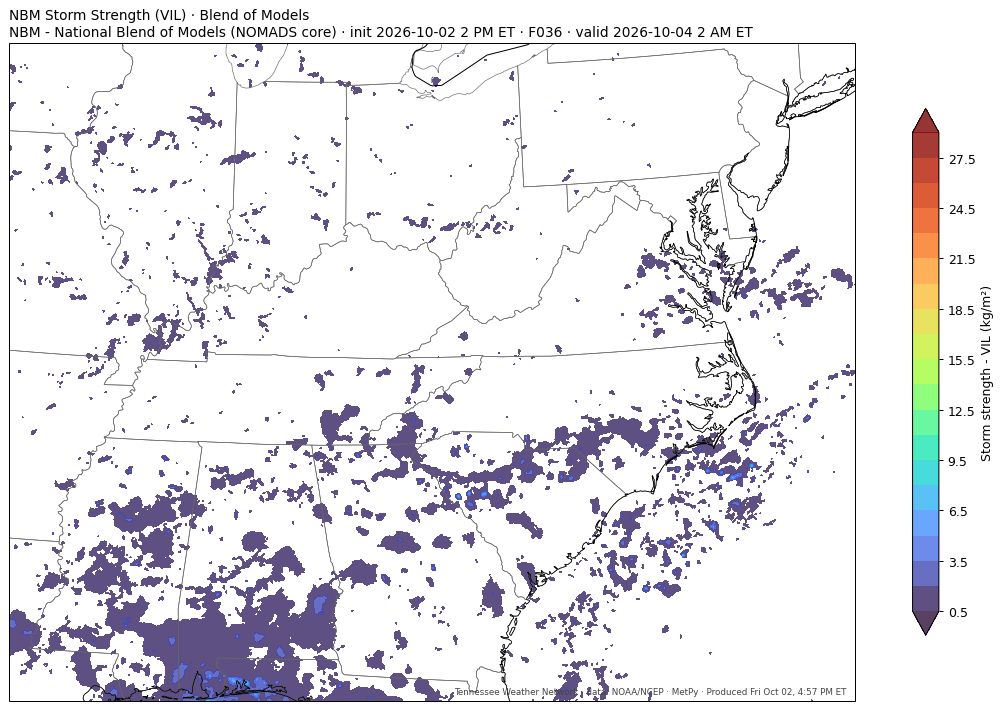
NBM · nbm_refc (us · init 1002Z 18Z)
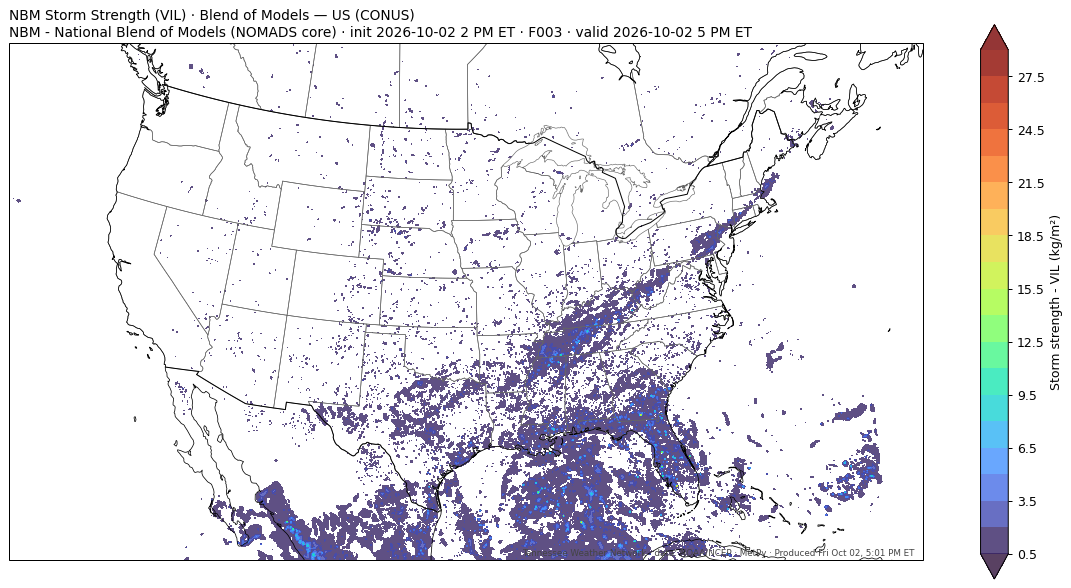
Rendered locally with MetPy · full size
single frame - more hours render each update cycle
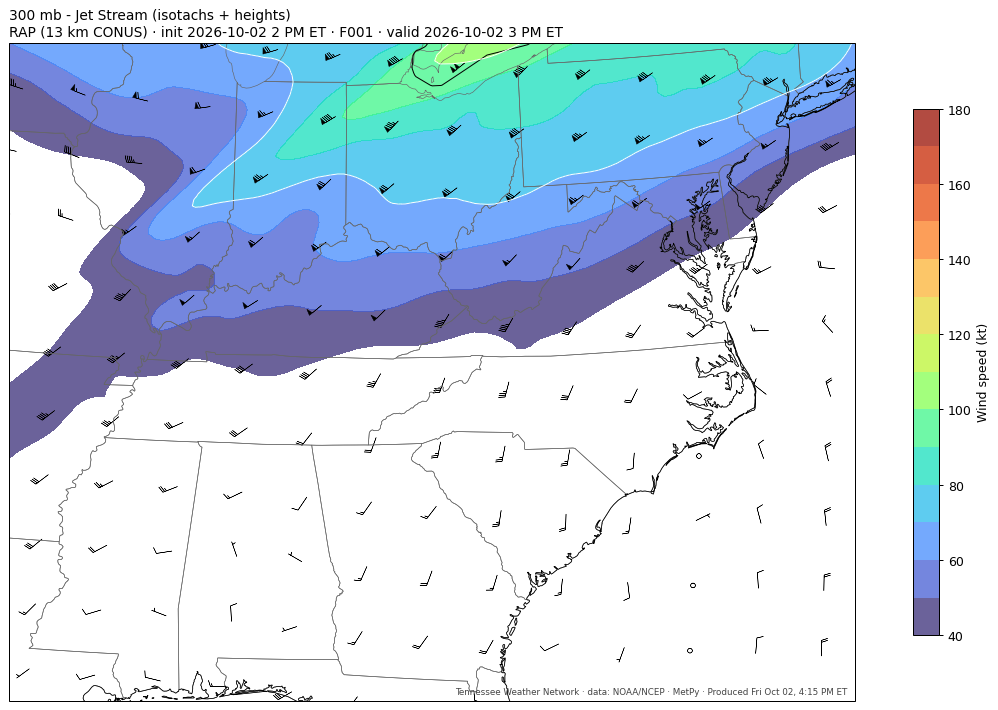
RAP · 300_jet (etn · init 1002Z 18Z)
Rendered locally with MetPy · full size
single frame - more hours render each update cycle
RAP · 850_tmp (us · init 1002Z 18Z)
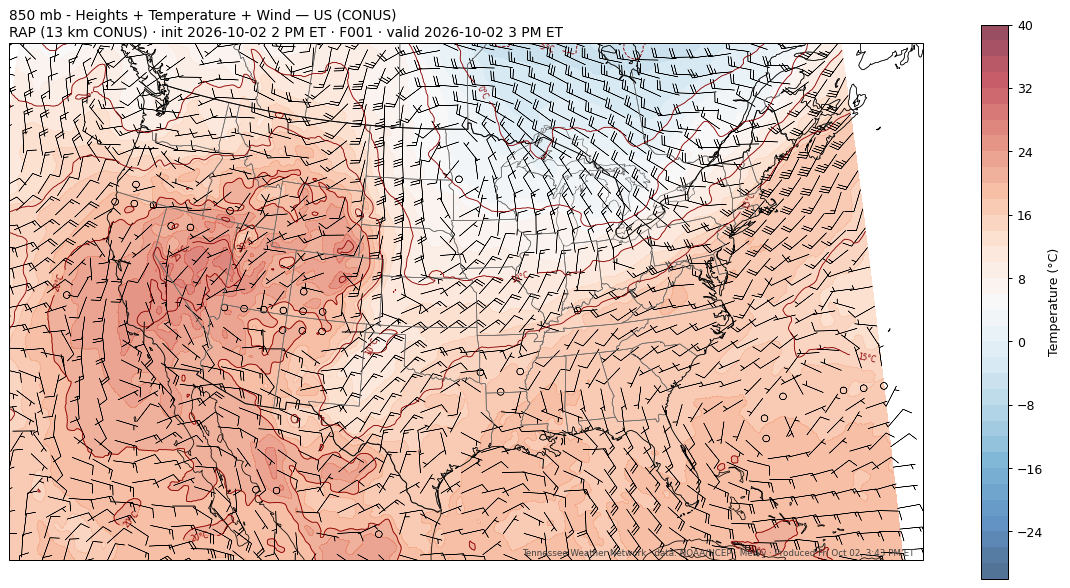
Rendered locally with MetPy · full size
single frame - more hours render each update cycle
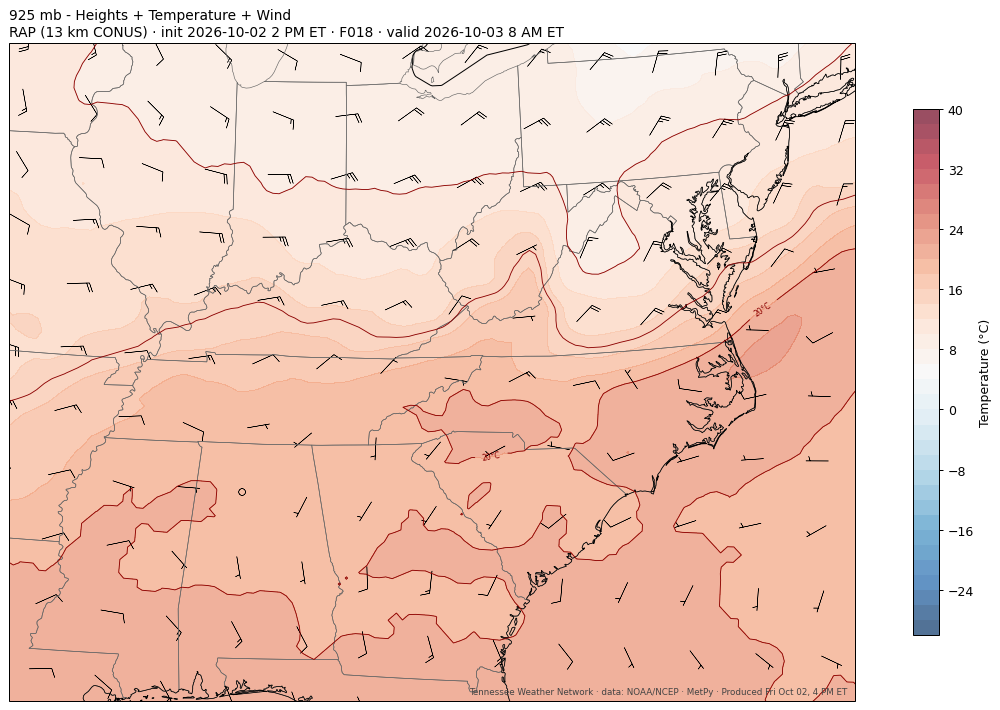
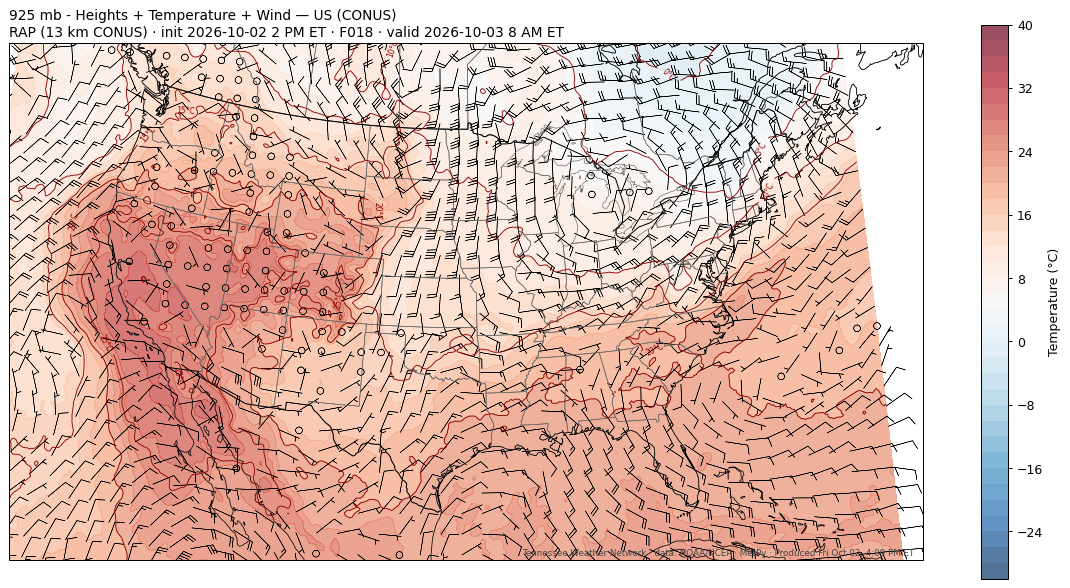
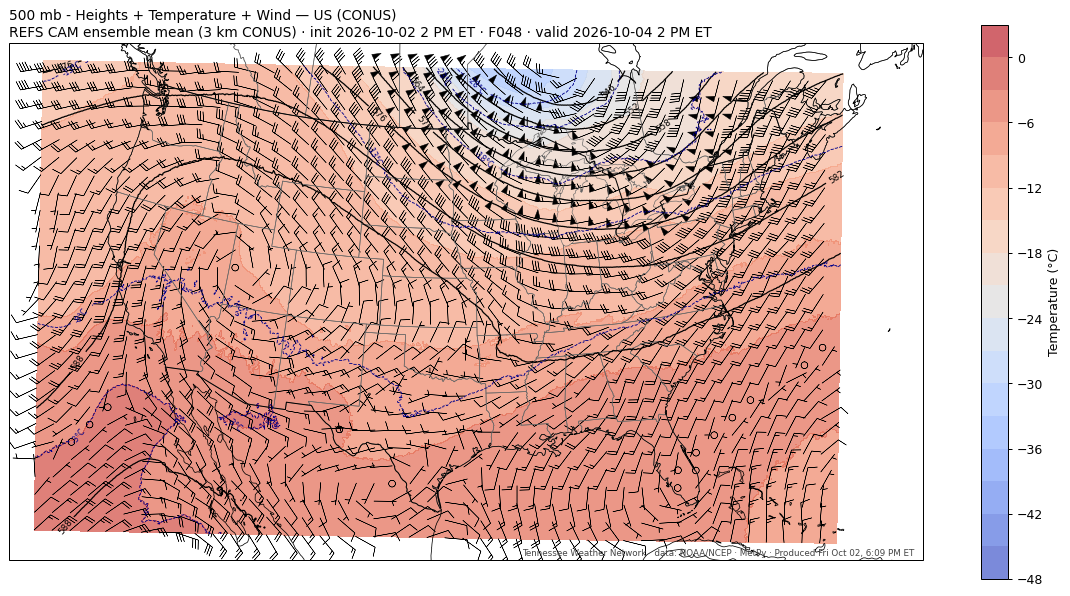
REFS · 850_tmp (etn · init 1002Z 18Z)
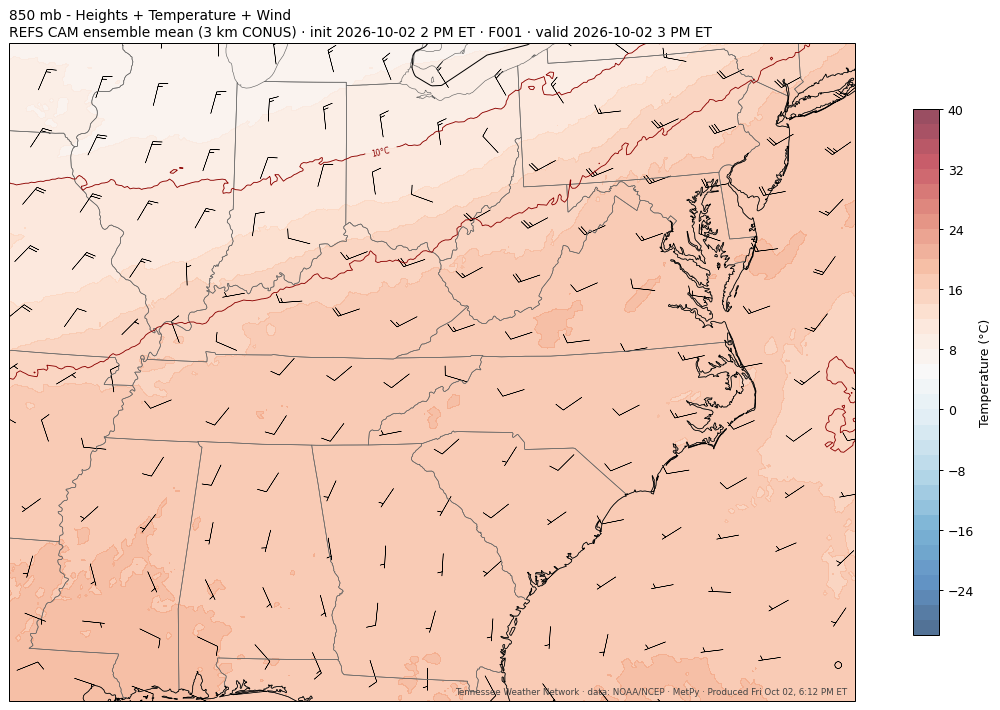
Rendered locally with MetPy · full size
single frame - more hours render each update cycle
🌍 MPAS + FV3 (SHiELD) — experimental global models
--
NCAR MPAS-A real-time global 3.75 km and GFDL SHiELD — the FV3-core model — official pre-rendered frames, animated. One product set downloads per update cycle and is cached; the rest queue and fill in automatically.